Infographic Design
As part of our suite of service offerings, we specialize in infographic creation for businesses across different industries, including professional and financial services, legal services, and real estate.
What is an infographic?
An infographic is a visual representation of information designed to communicate a story to the viewer in an aesthetic, clear, concise, and digestible manner.How do Businesses benefit from the use of Infographics?
Today, people lack patience when presented with complex information. Hence, it is vital to explain the value of your business quickly and in a viewer-friendly format. A well-designed infographic has an immediate impact on the viewer. Achieving this impact is our specialty at Odgis + Co. We distill and synthesize complex ideas into an engaging and visually pleasing format for your clients and stakeholders.“A designer knows he has achieved perfection not when there is nothing left to add, but when there is nothing left to take away.”
Antoine de Saint-Exupery, author and aviator (15 Dec 1913-1980)

CASE STUDY: The Rockefeller University Graduate Program in Bioscience Brochure
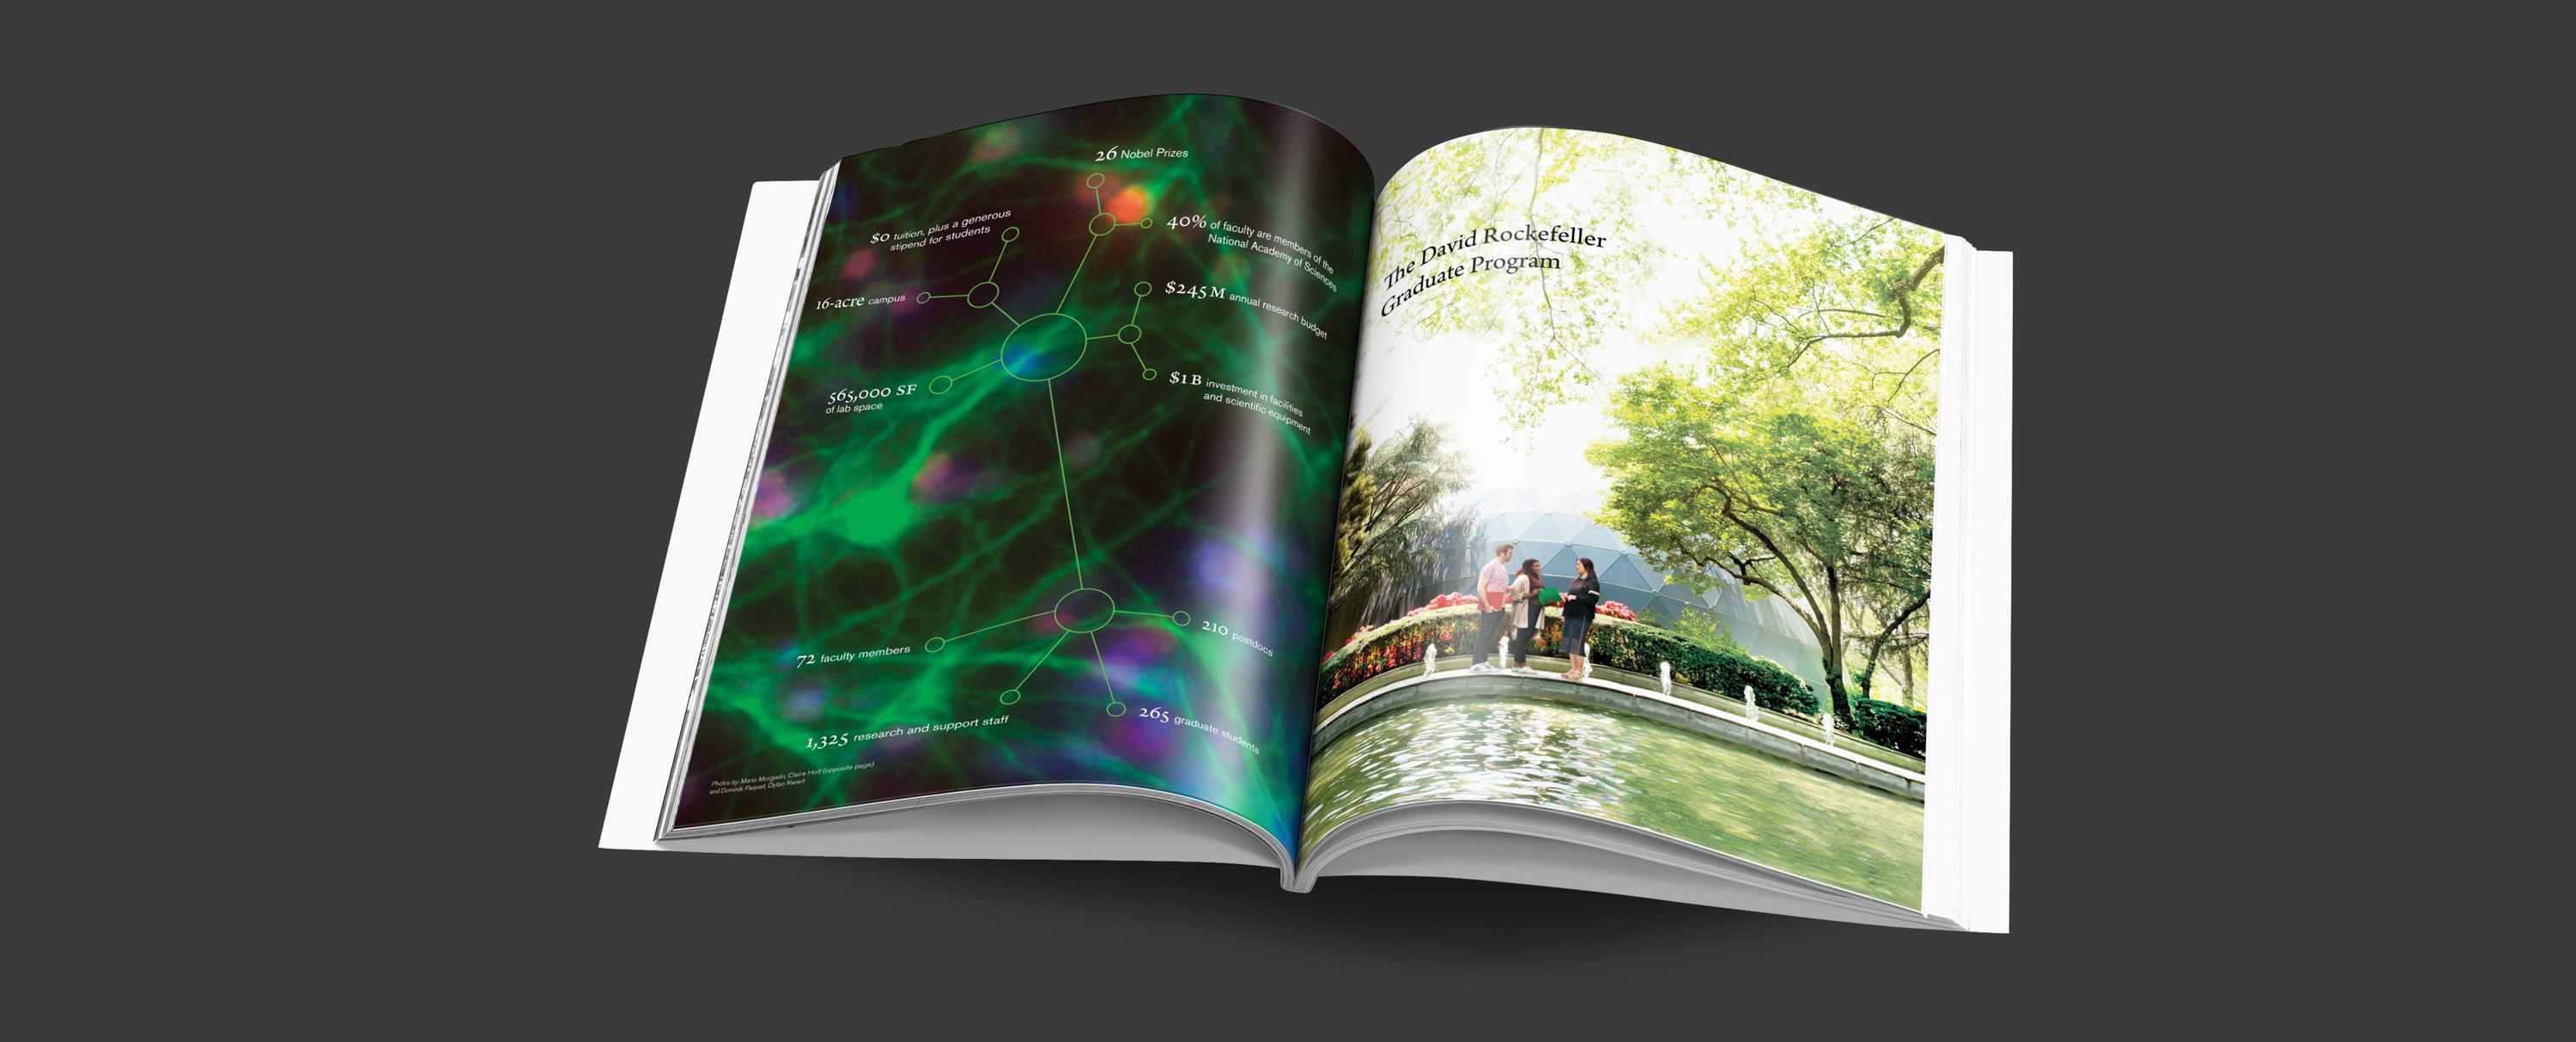
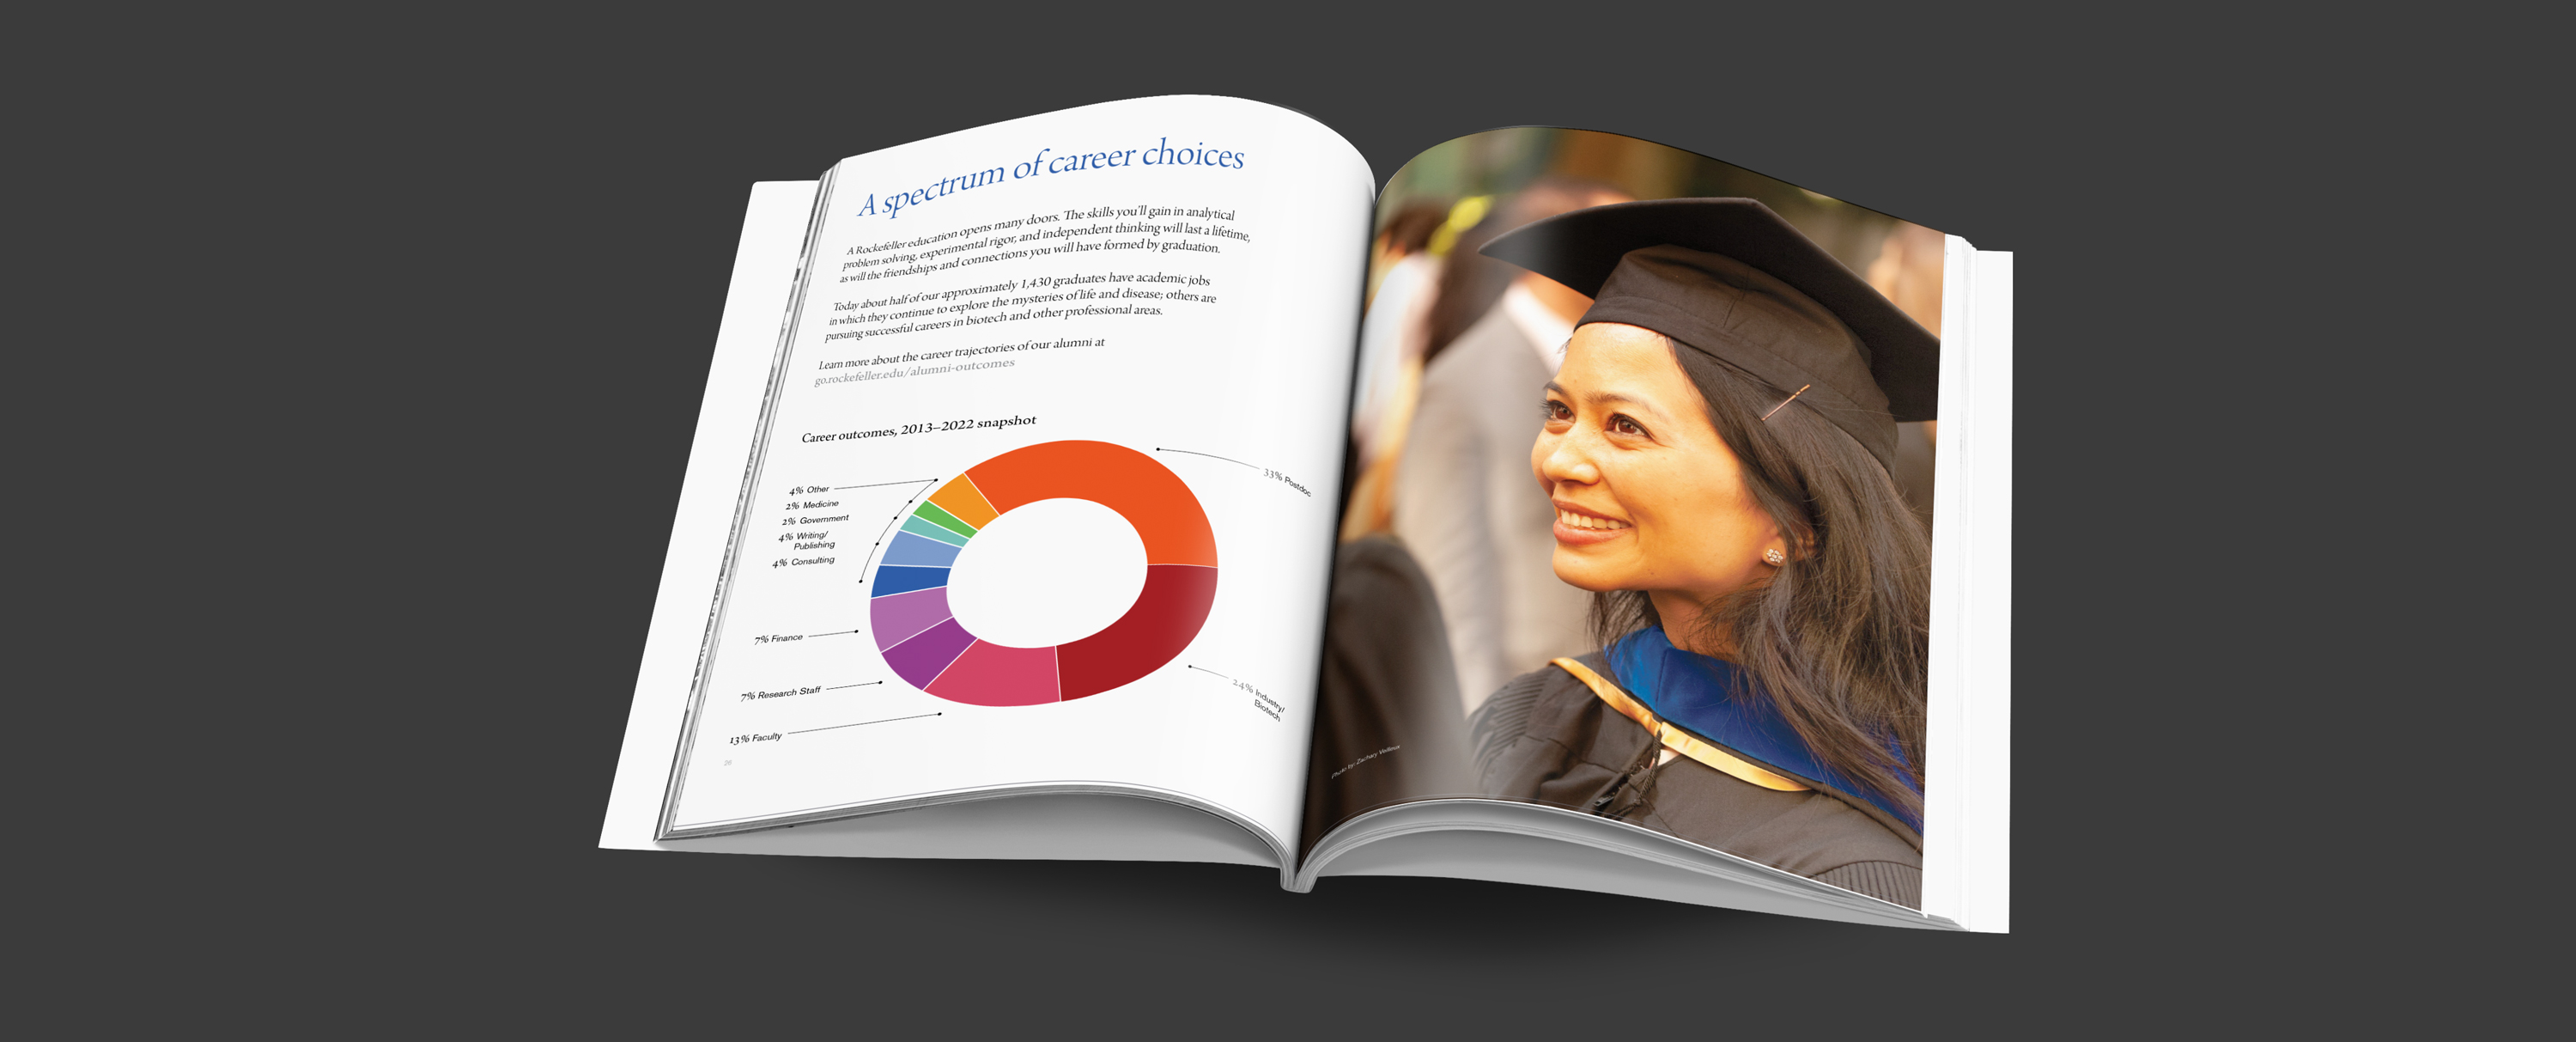
Odgis + Co created the viewbook for The Rockefeller University Graduate Program in Bioscience. This publication marks the resurgence of in-person learning and showcases the program's diverse community and the splendid environment of its New York City campus. The design aims to engage the reader in the culture of this advanced scientific research institution through infographics and images that captures the spirit of the social and scientific network that is The Rockefeller University.
Case Study: The Rockefeller University Financial Annual Report
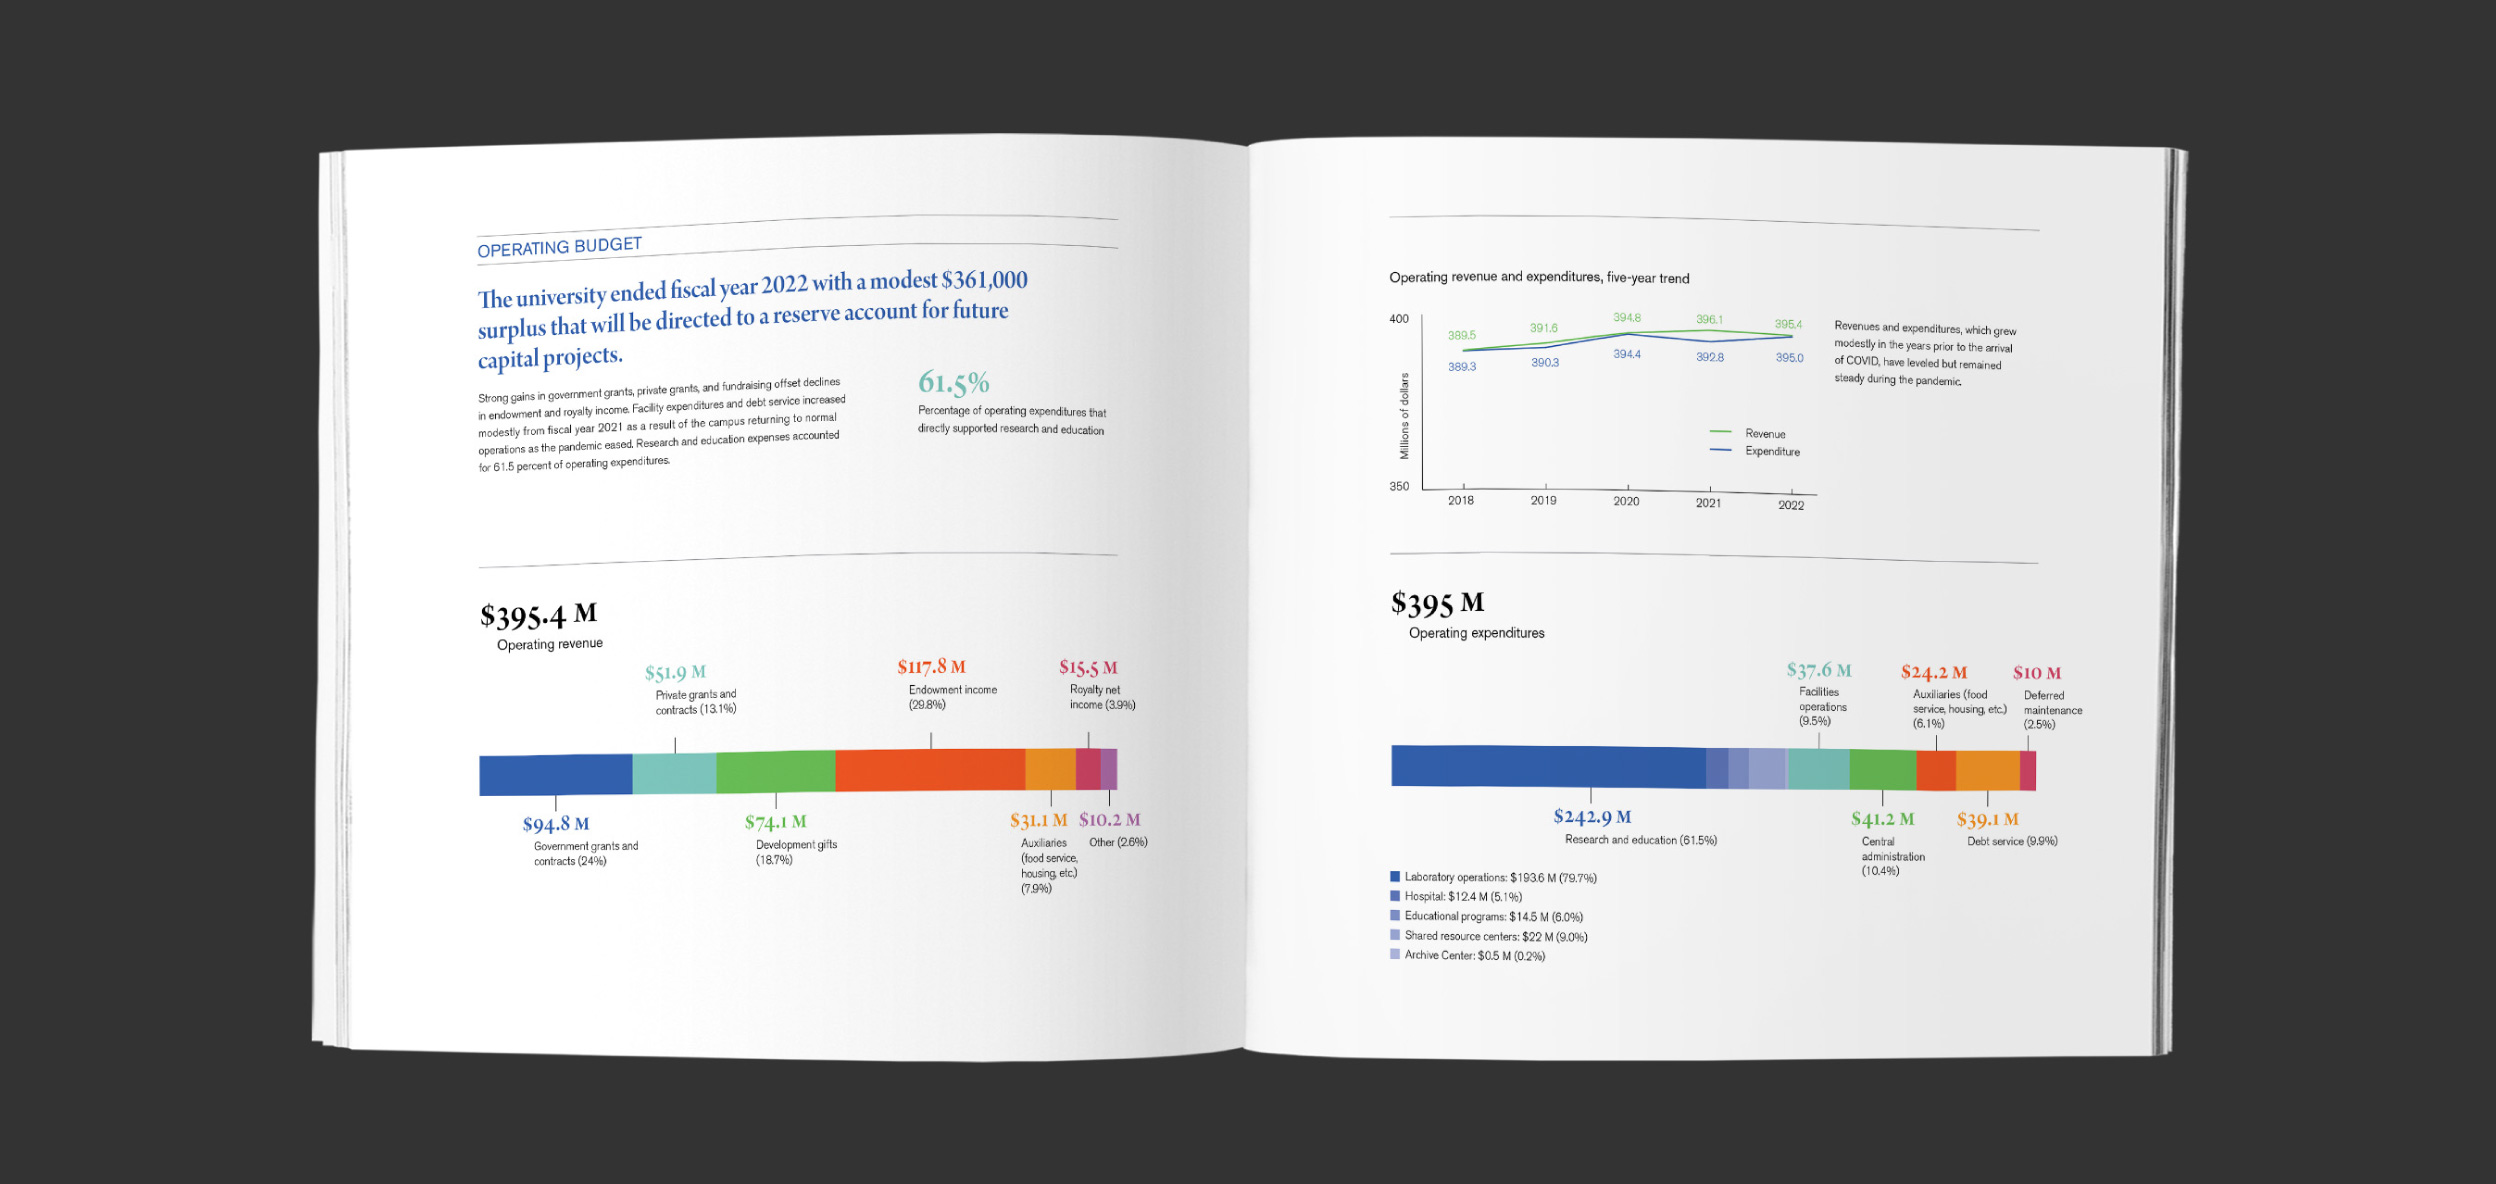
The 2022 Rockefeller University Financial Annual Report is punctuated with infographics that support the narrative throughout the report.
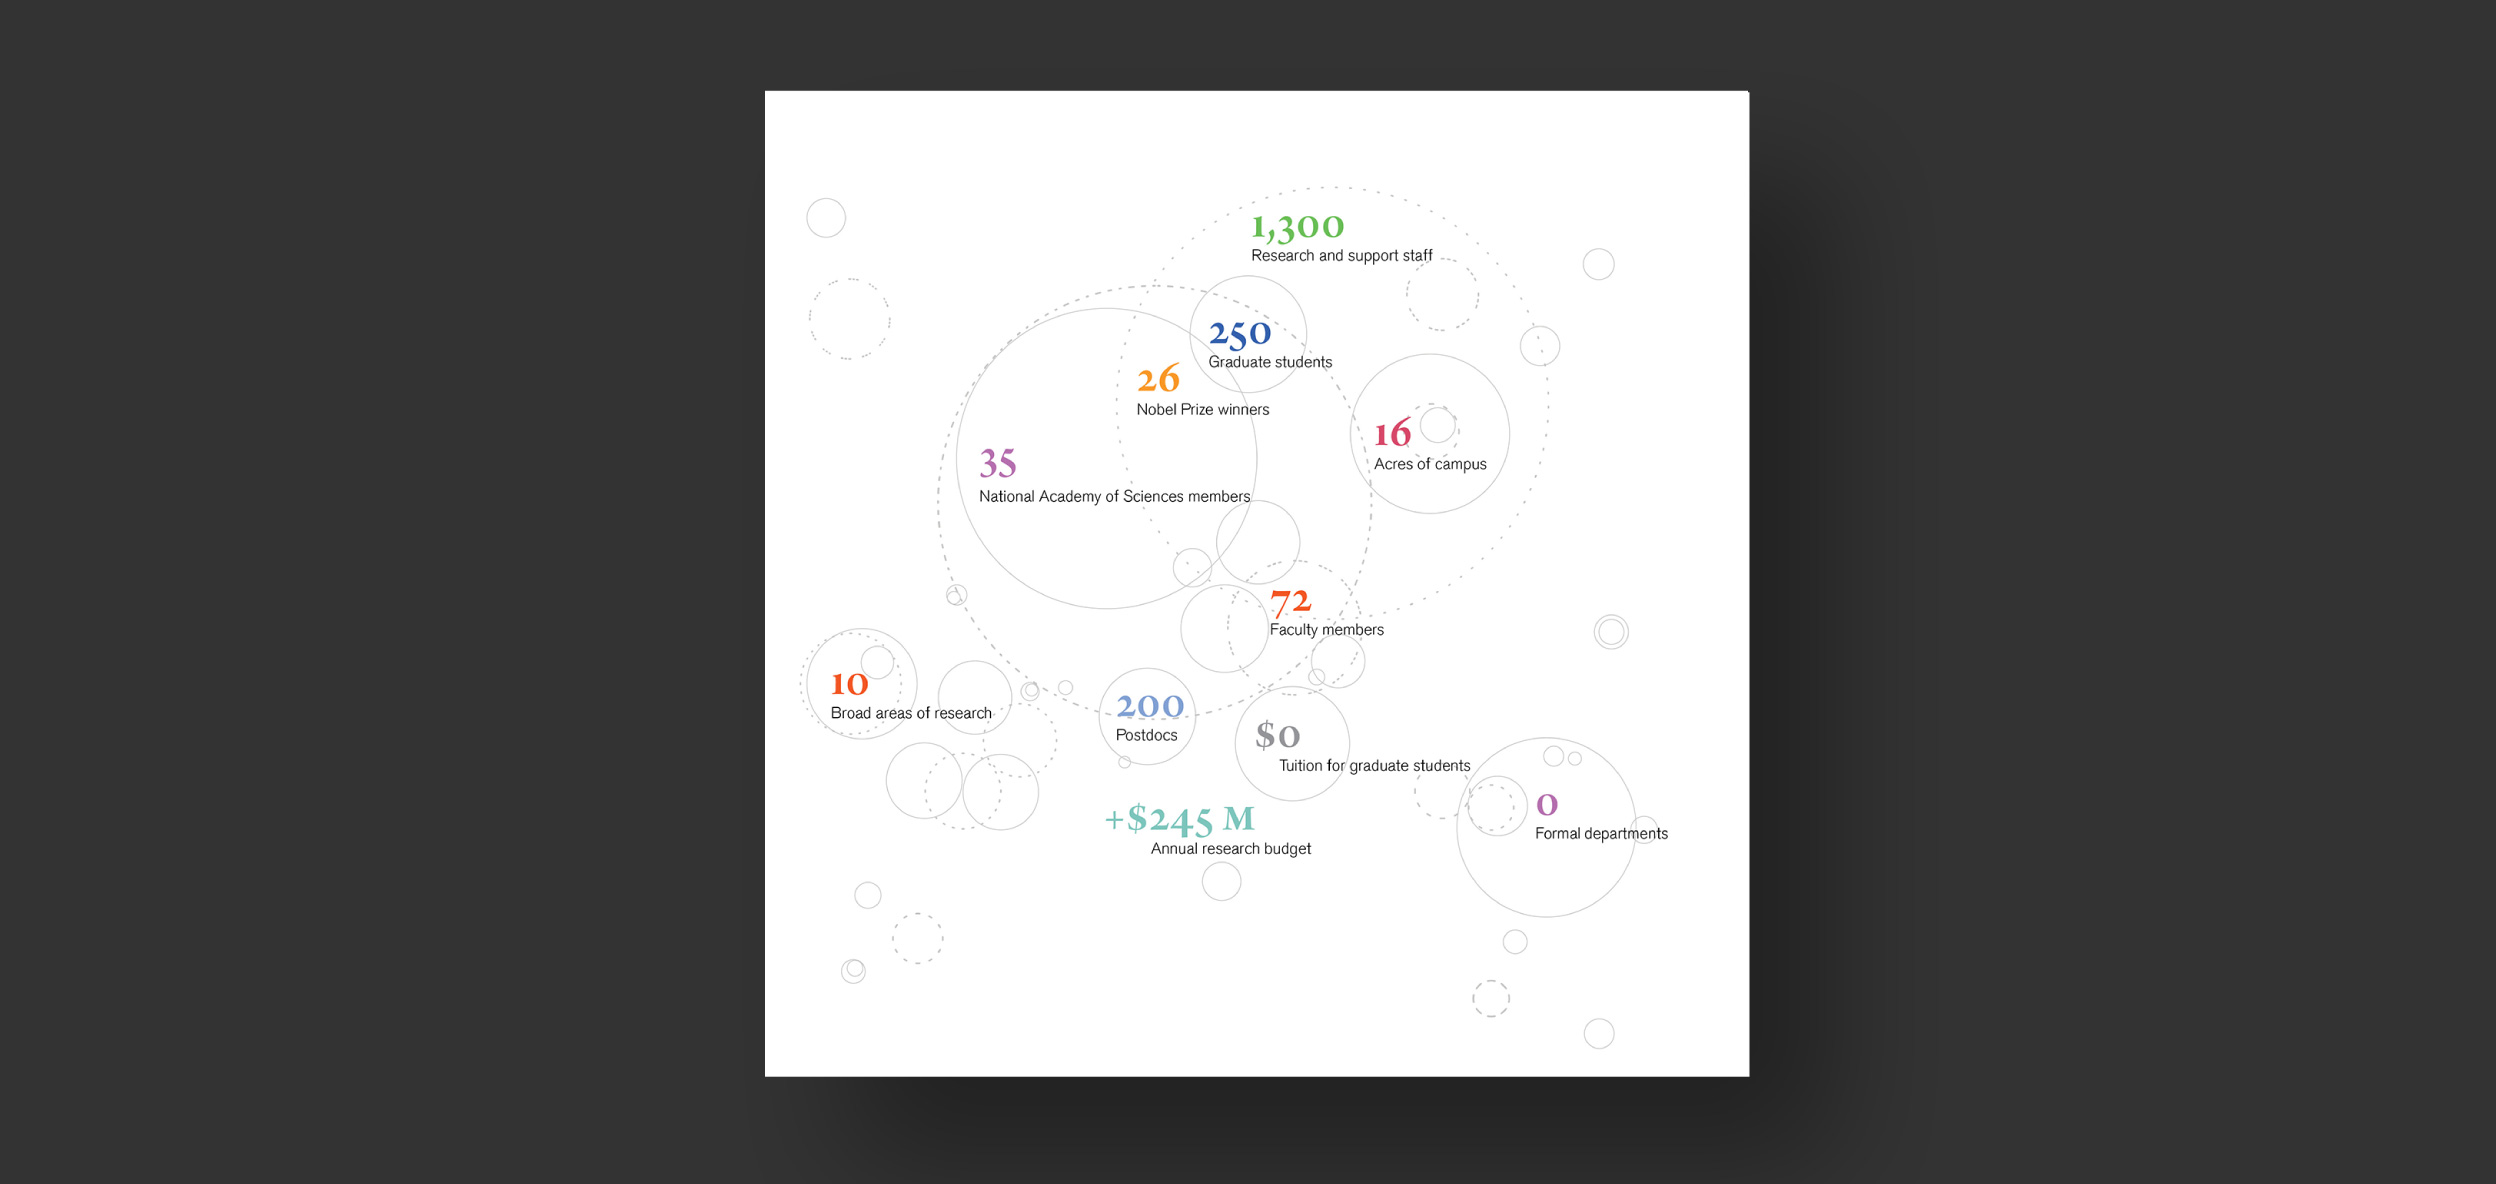
As the reader opens the book, a cell-like, circular line graphic reveals key quantitative information, which helps to summarize the story. In contrast, on the back cover Rockefeller University’s oasis-like campus is rendered with an angular and scientific feel. Their financial picture and metrics offer a snapshot of the university’s flourishing health, illustrated in vibrant charts and graphs.
As the reader opens the book, a cell-like, circular line graphic reveals key quantitative information, which helps to summarize the story. In contrast, on the back cover Rockefeller University’s oasis-like campus is rendered with an angular and scientific feel. Their financial picture and metrics offer a snapshot of the university’s flourishing health, illustrated in vibrant charts and graphs.
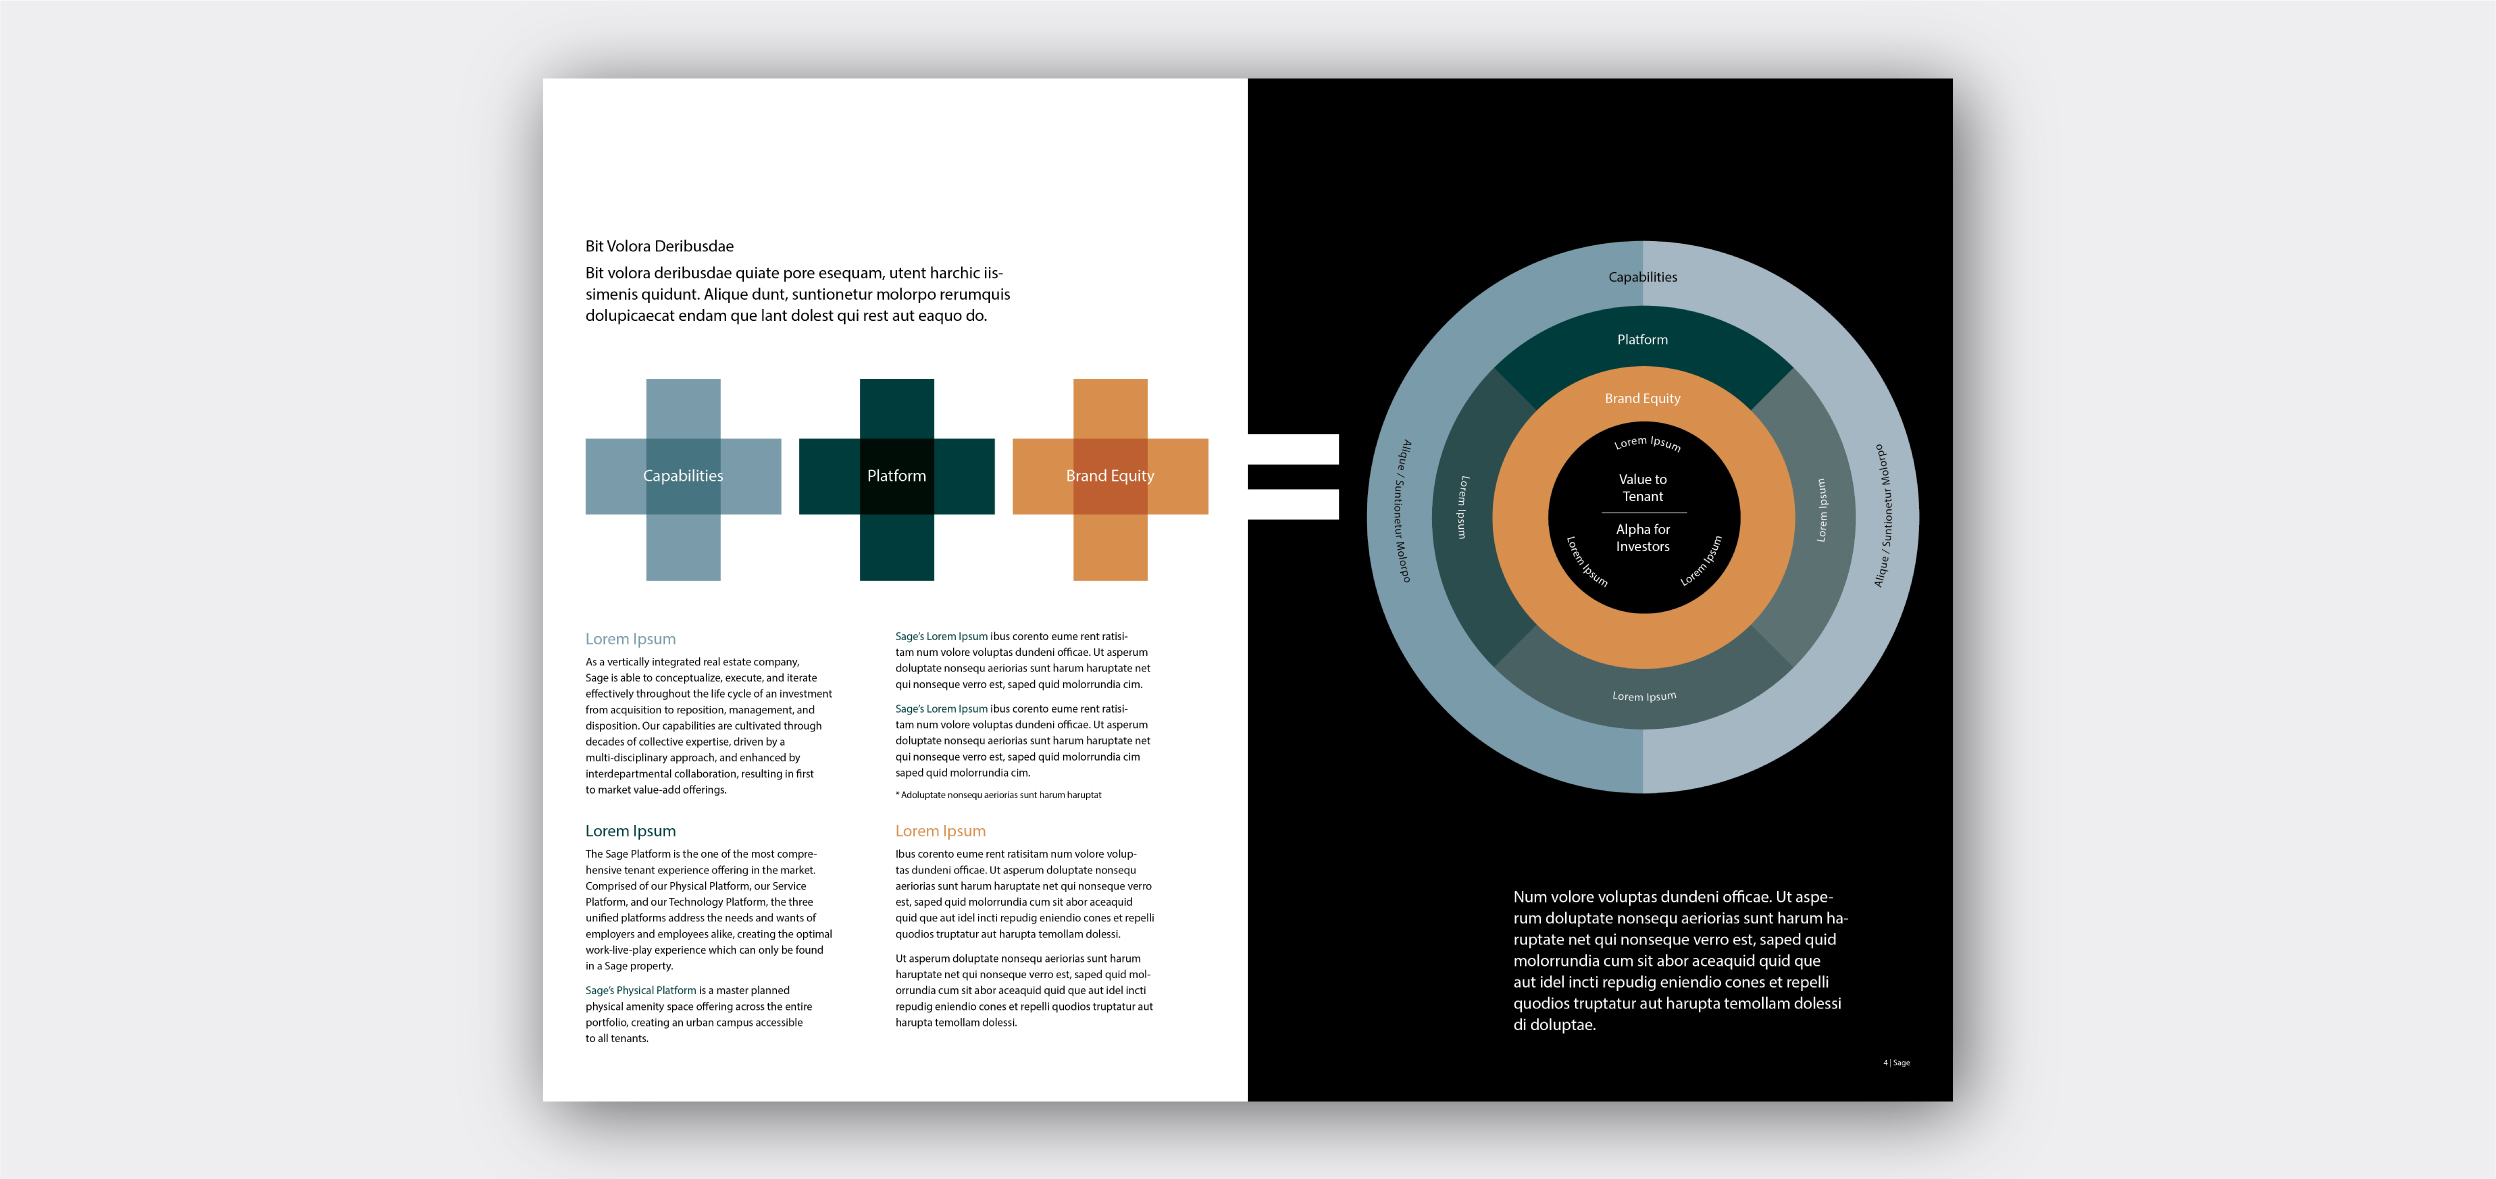
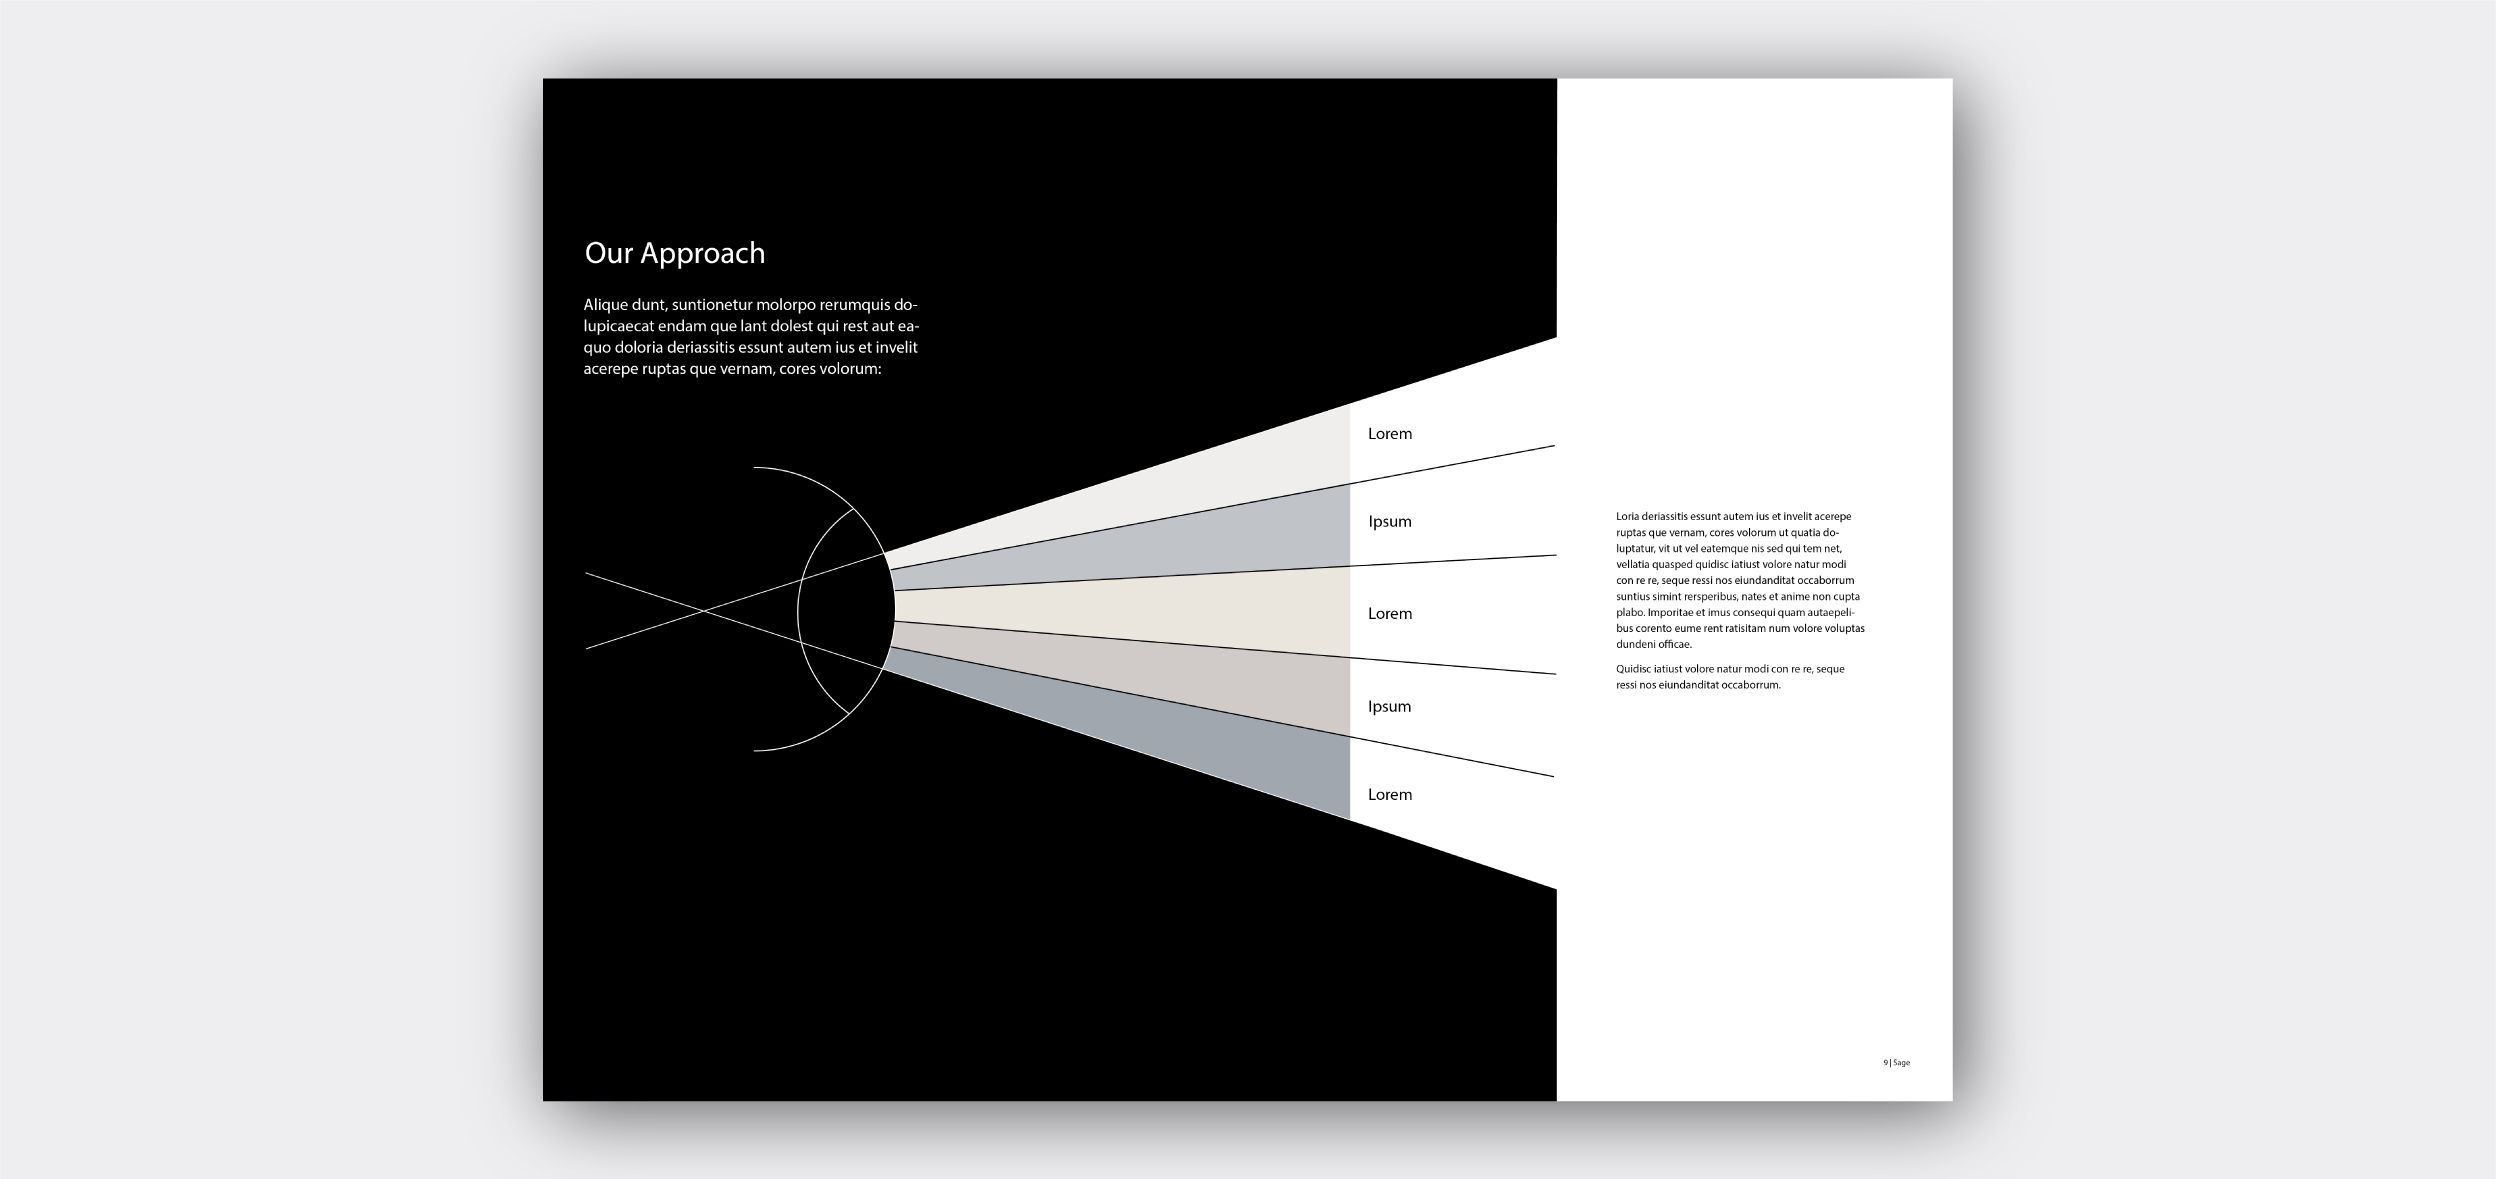
CASE STUDY: Sage Pitch Deck
Odgis + Company collaborated with Sage Realty to develop a comprehensive pitch deck that showcases their commitment to "Enriching the lives of people at work." Within this presentation, we visually conveyed their strategic approach using infographics, diagrams, and photos, providing a clear depiction of their distinctive processes and future growth plans. Throughout the deck, a plus sign motif is employed as a symbol of added value. The strategic incorporation of these black linear forms serves to punctuate and frame images and informational diagrams dynamically.
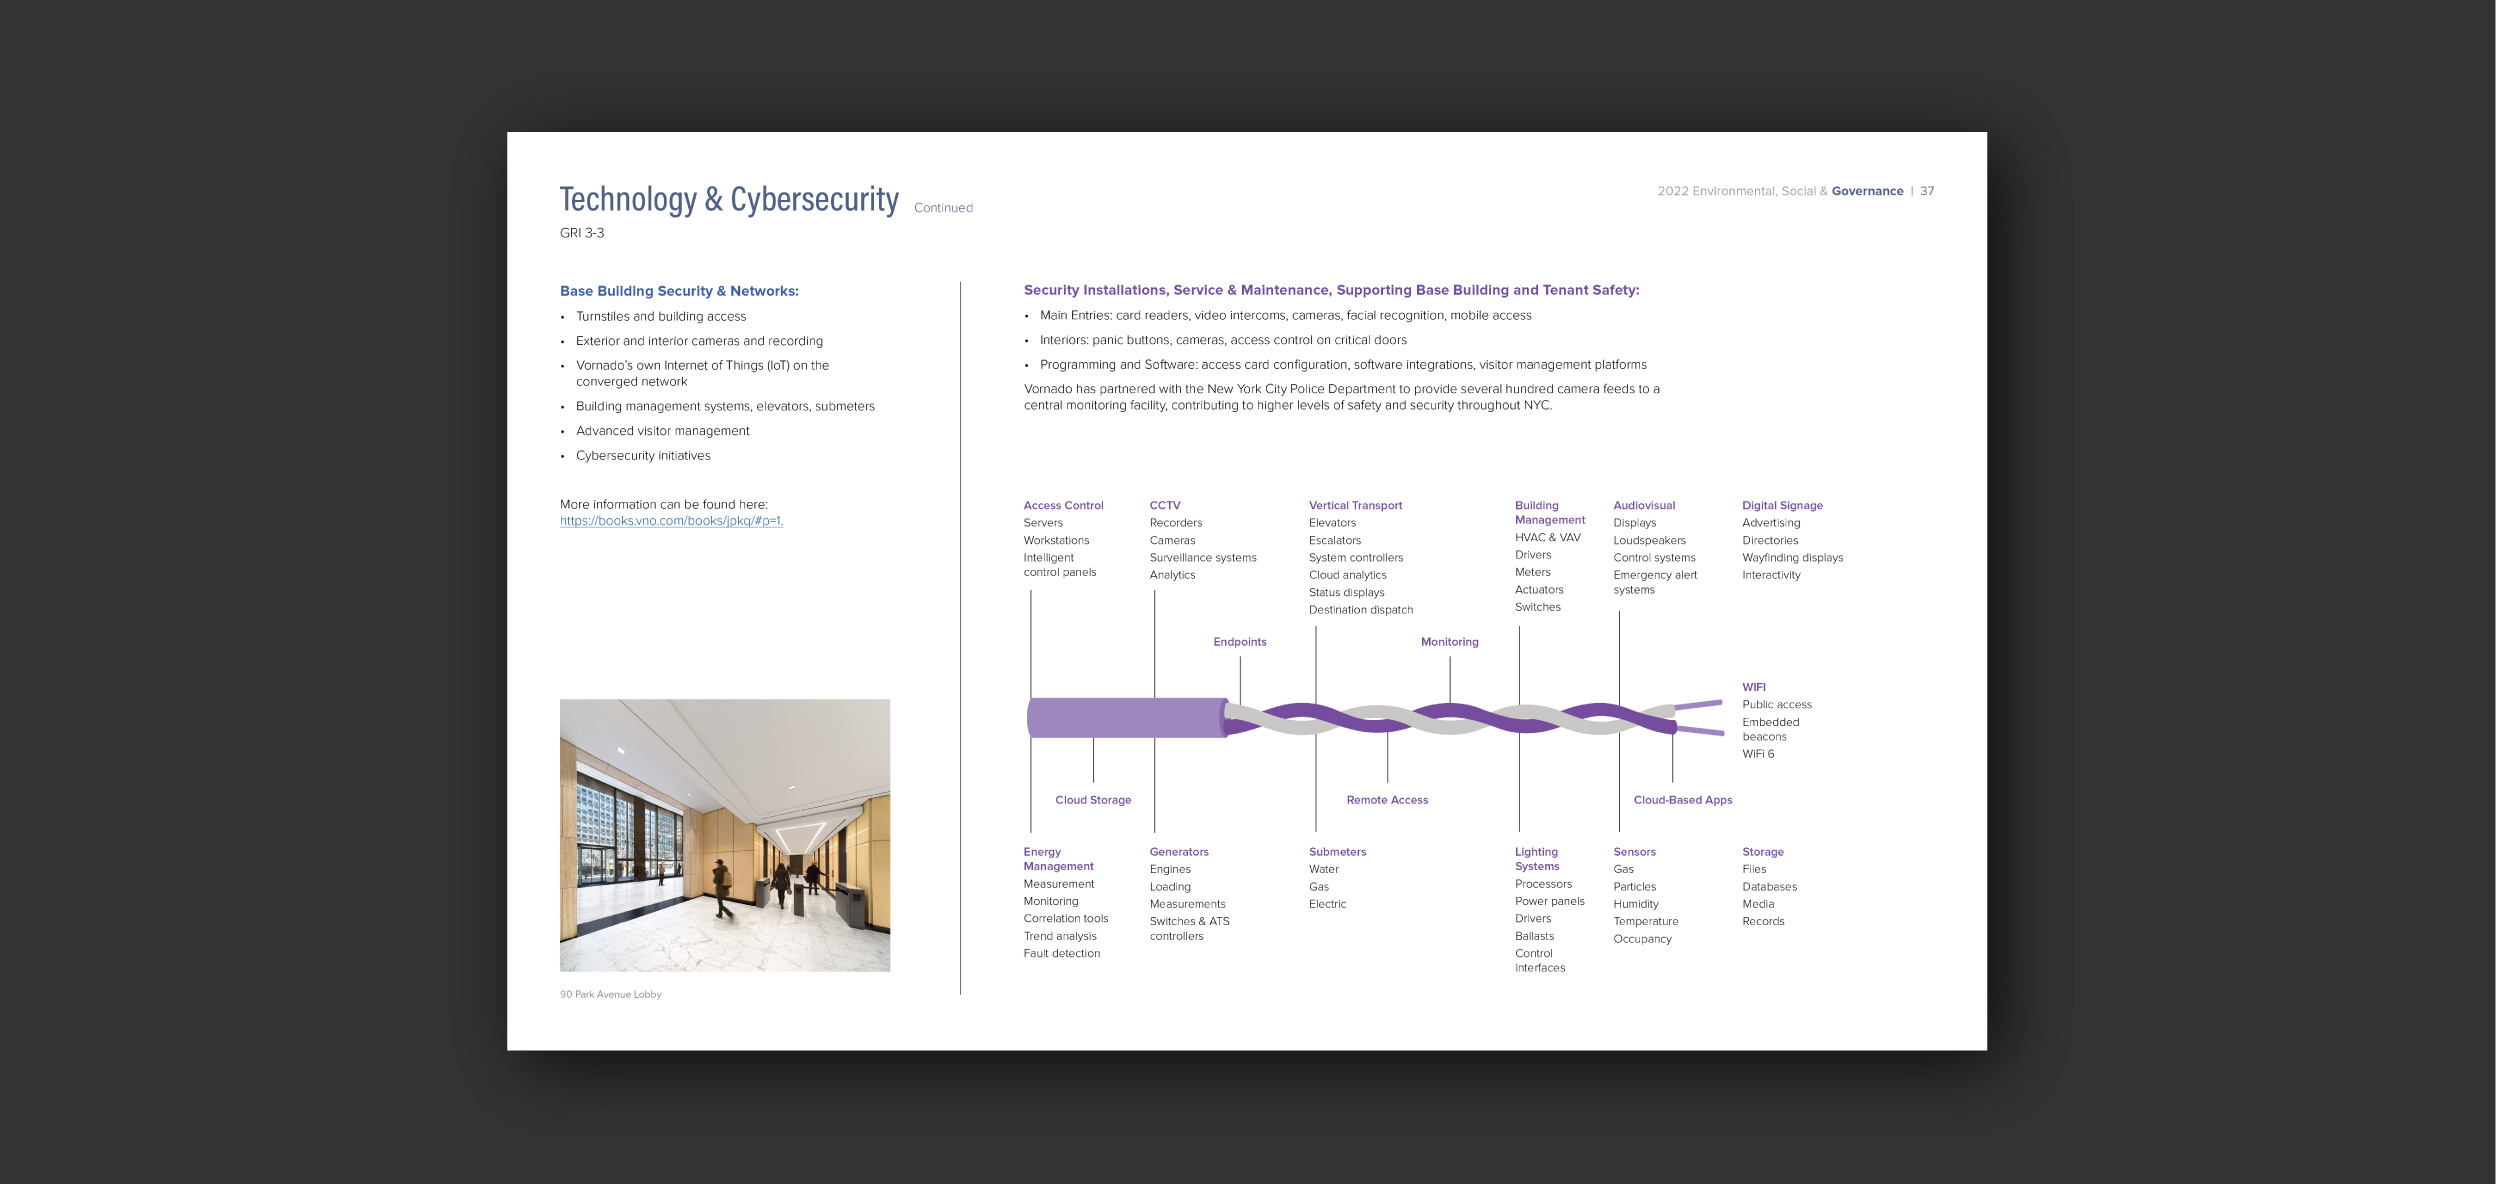
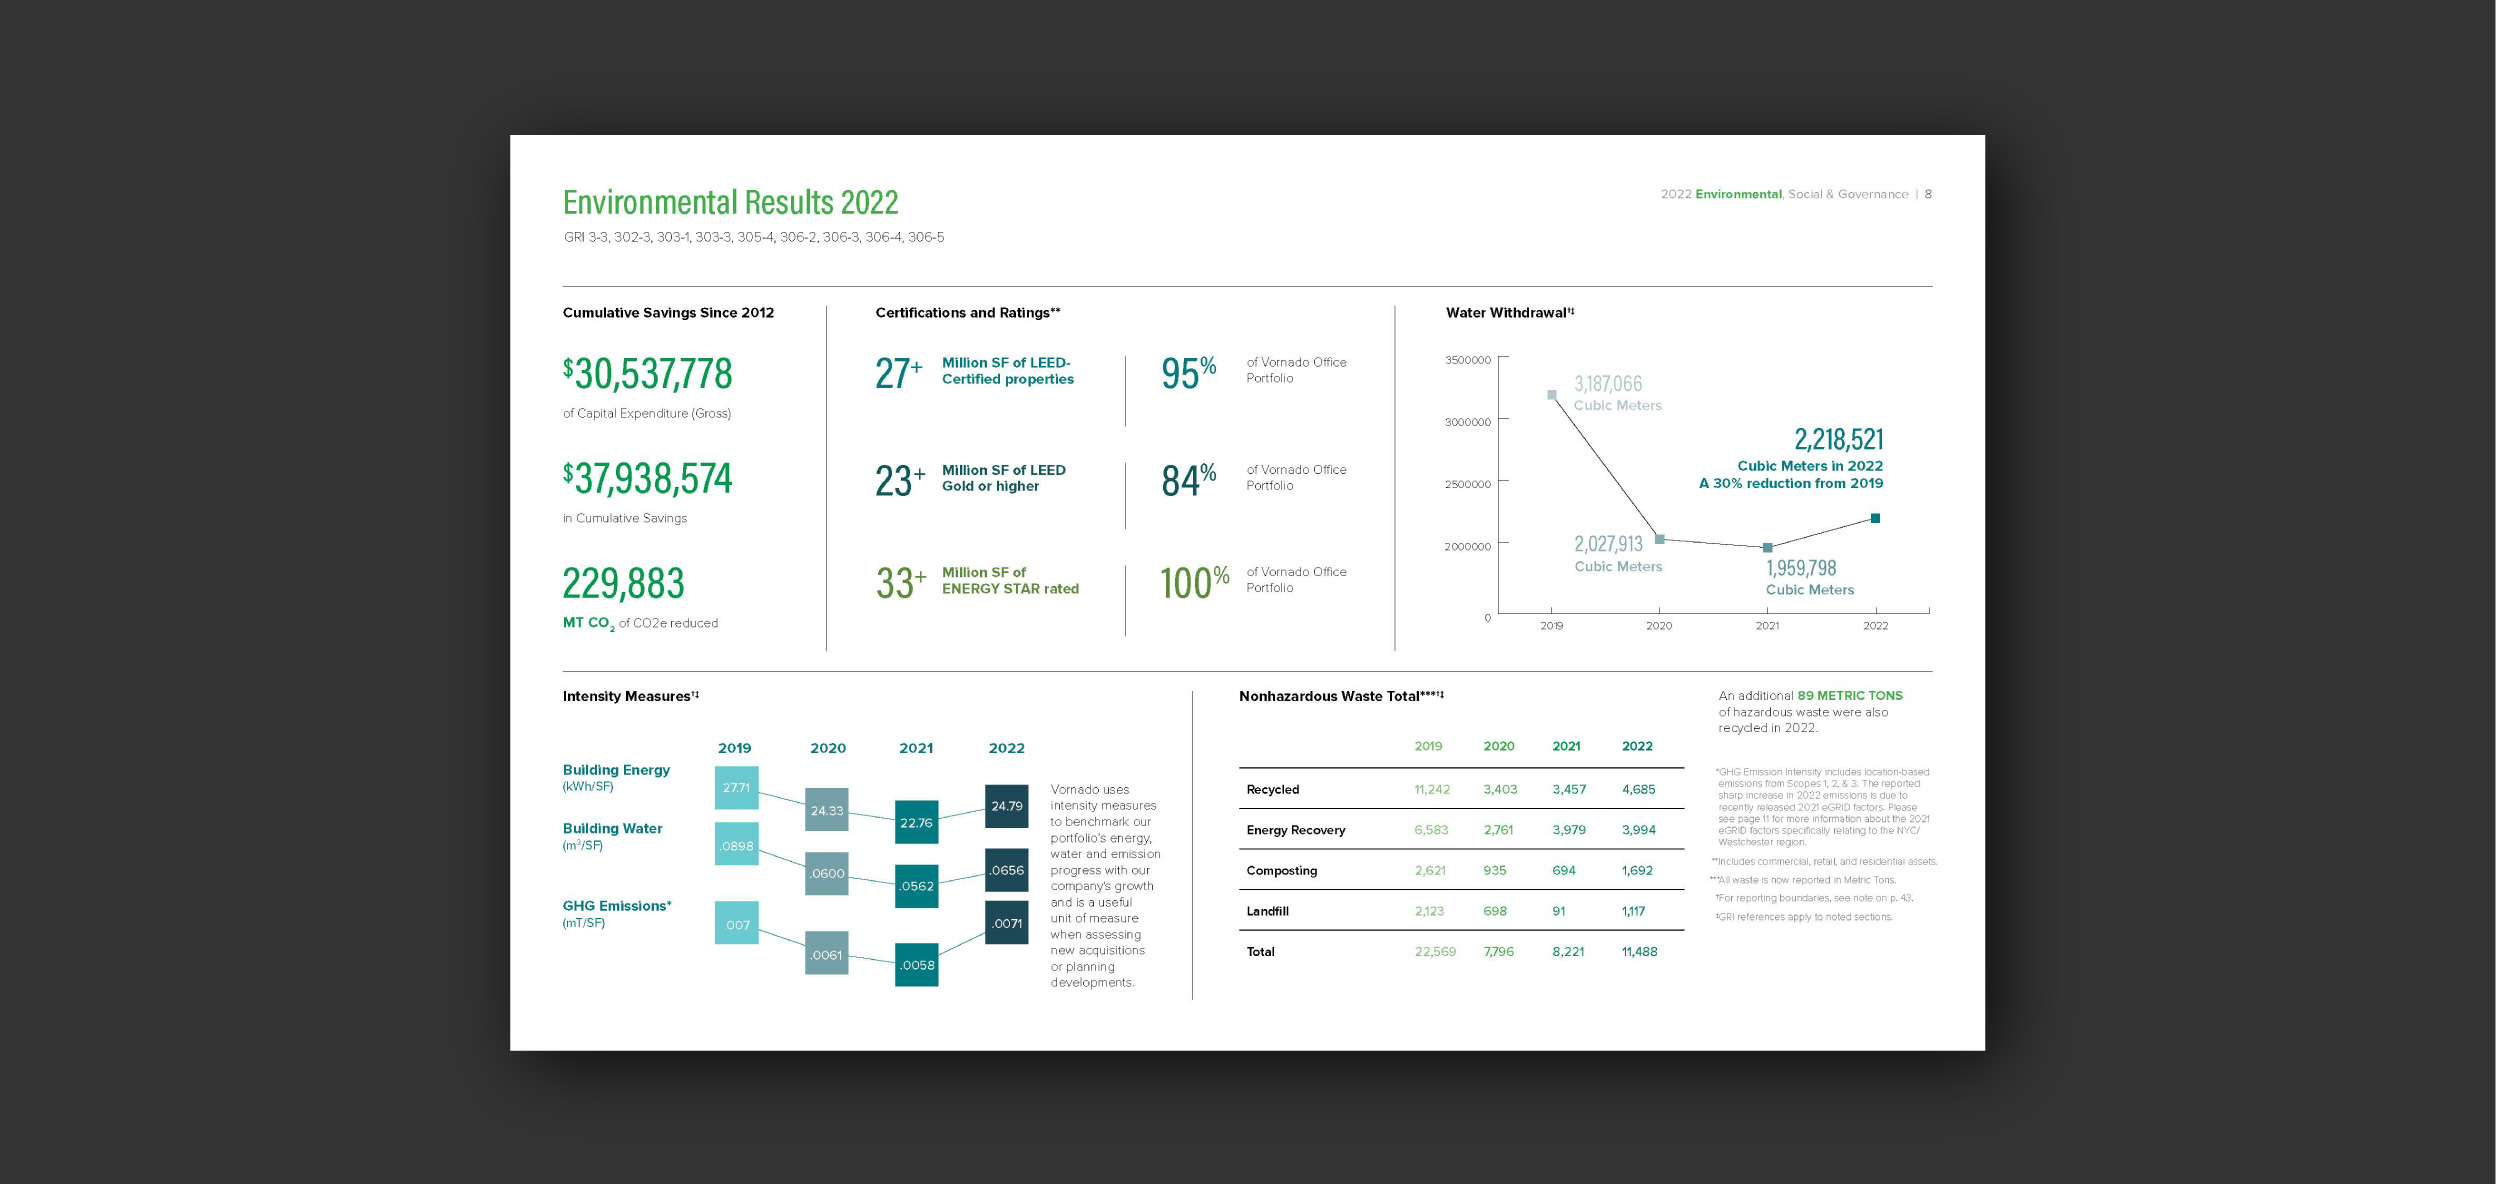
Case Study: Vornado Realty Trust ESG Reports
For the past 10 years, Odgis + Co has proudly designed Vornado’s award-winning Sustainability & ESG Reports. In these publications we employed the use of infographics, combining narrative text, dashboards, and stats to seamlessly communicate Vornado’s story, strategy, and achievements to its clients and stakeholders. Developing this story began with discovery, where we worked closely with the Vornado team to understand the vision, achievements, and progress of their sustainability programs. After gaining intimate knowledge of the organization, we were able to begin crafting the story, capturing the essence of Vornado’s sustainability initiatives and illustrating the respective impact.
Infographics were used sparingly and strategically for the 2023 Vornado ESG Report to clarify information. This year our design approach was more minimal and direct. Given the complex nature of the subject, our goal was to declutter the narrative and make it accessible to all readers.
Following its release, the publication received accolades from its viewers for its aesthetics, readability, and flow. It was further recognized with the American Graphic Design Award and RGD’s So(cial) Good Design Award.
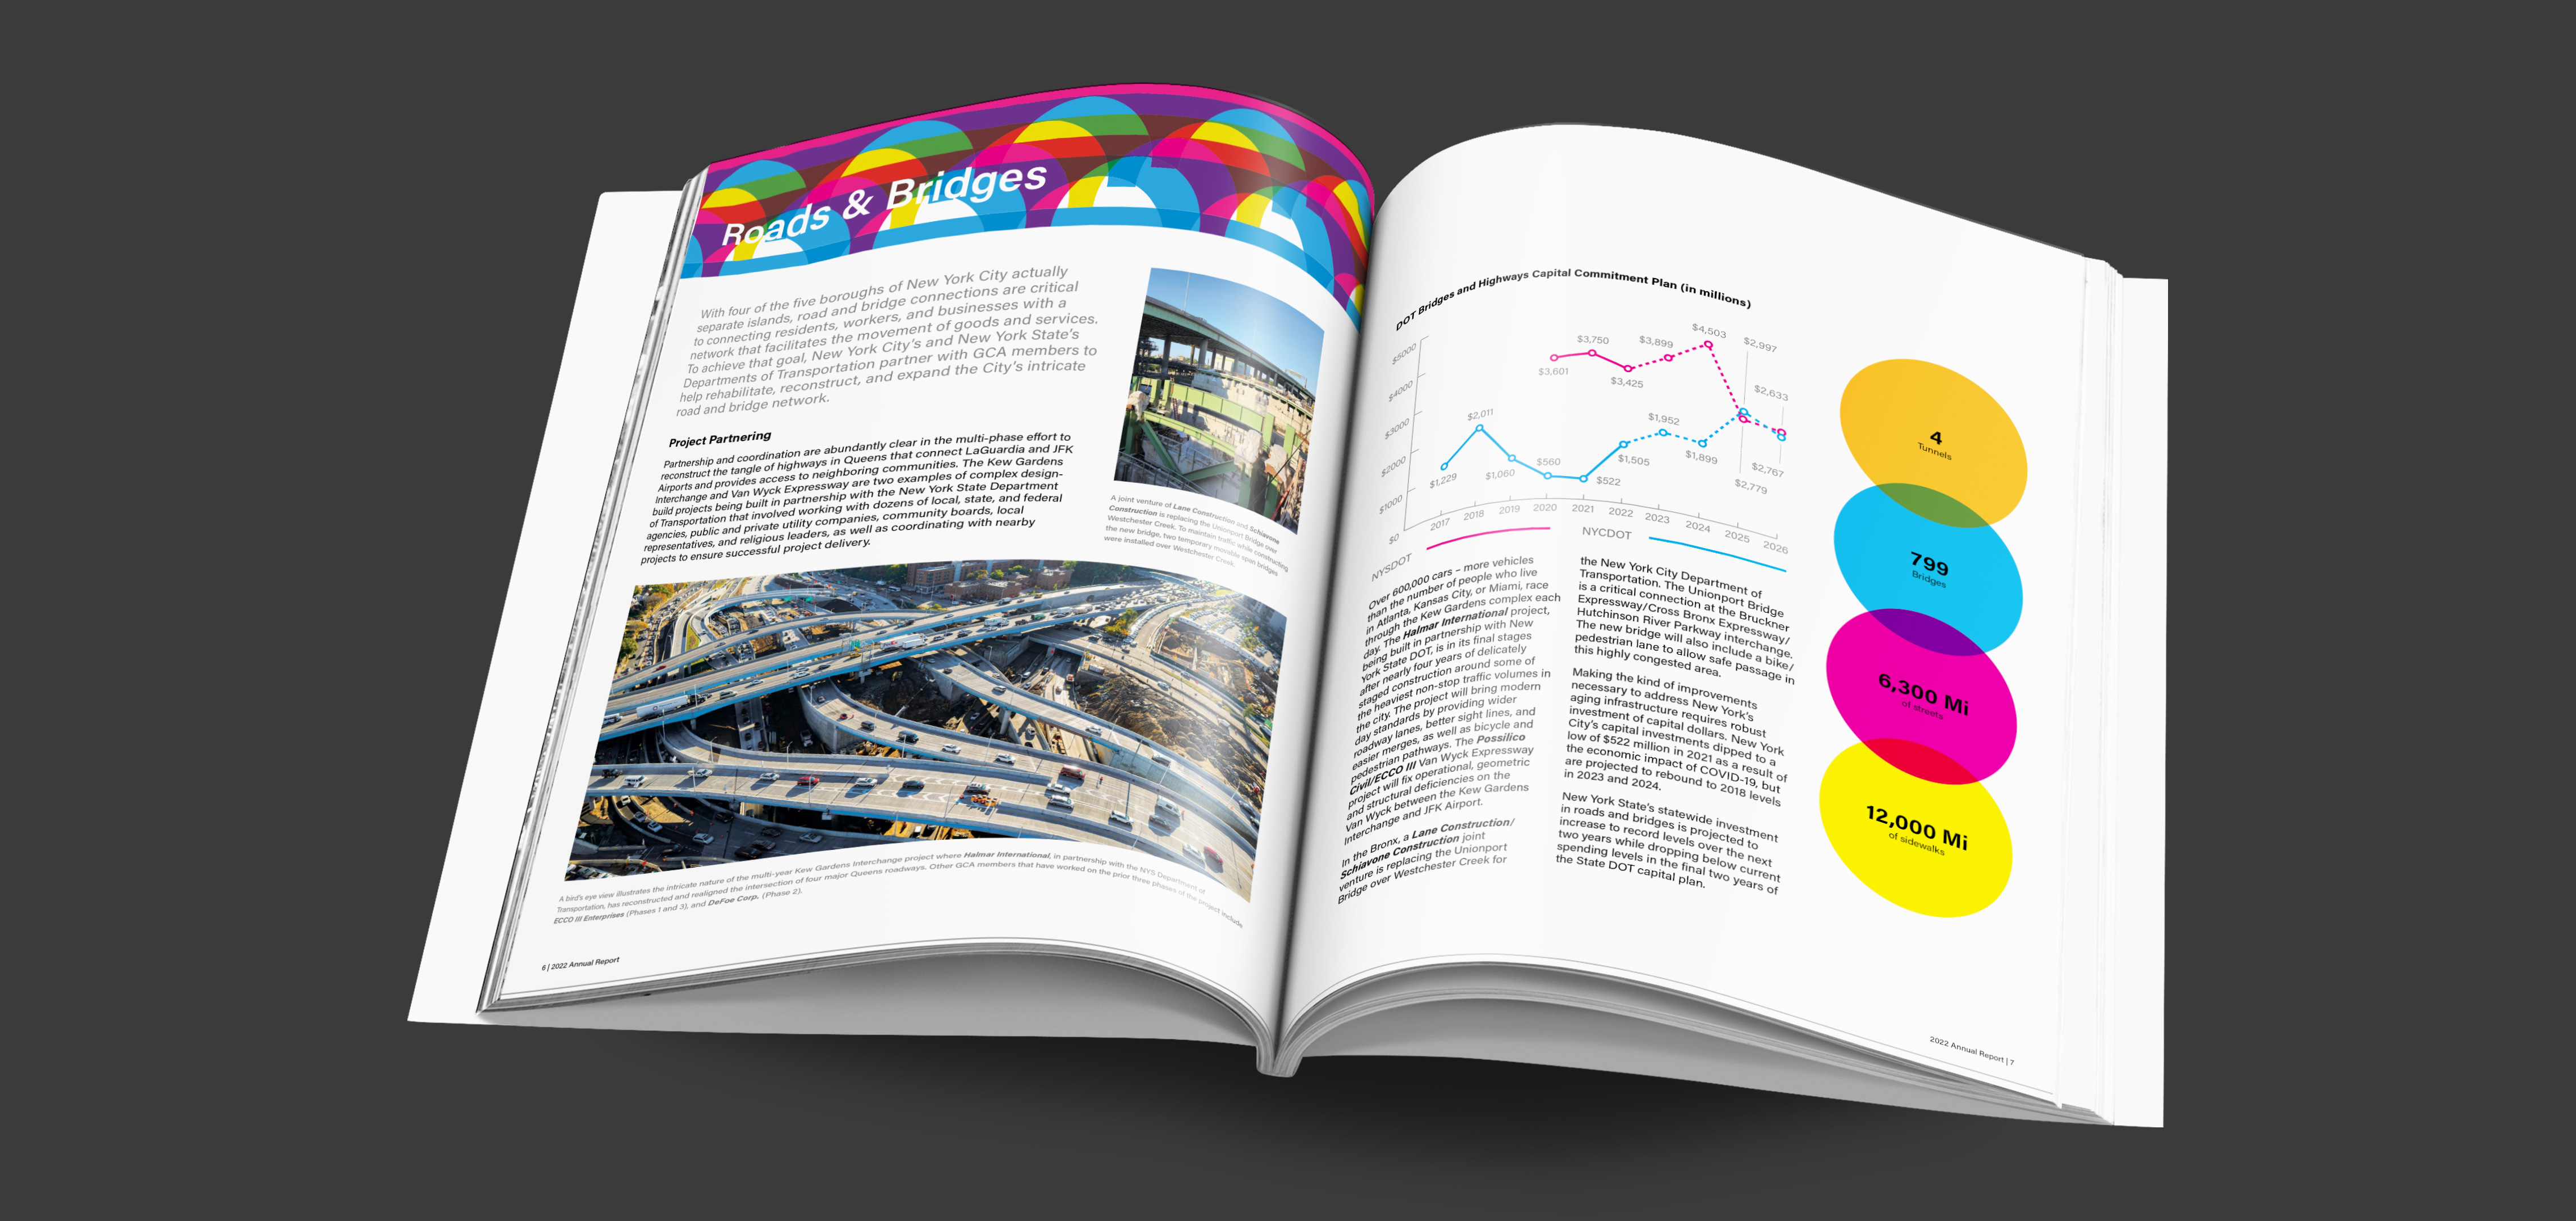
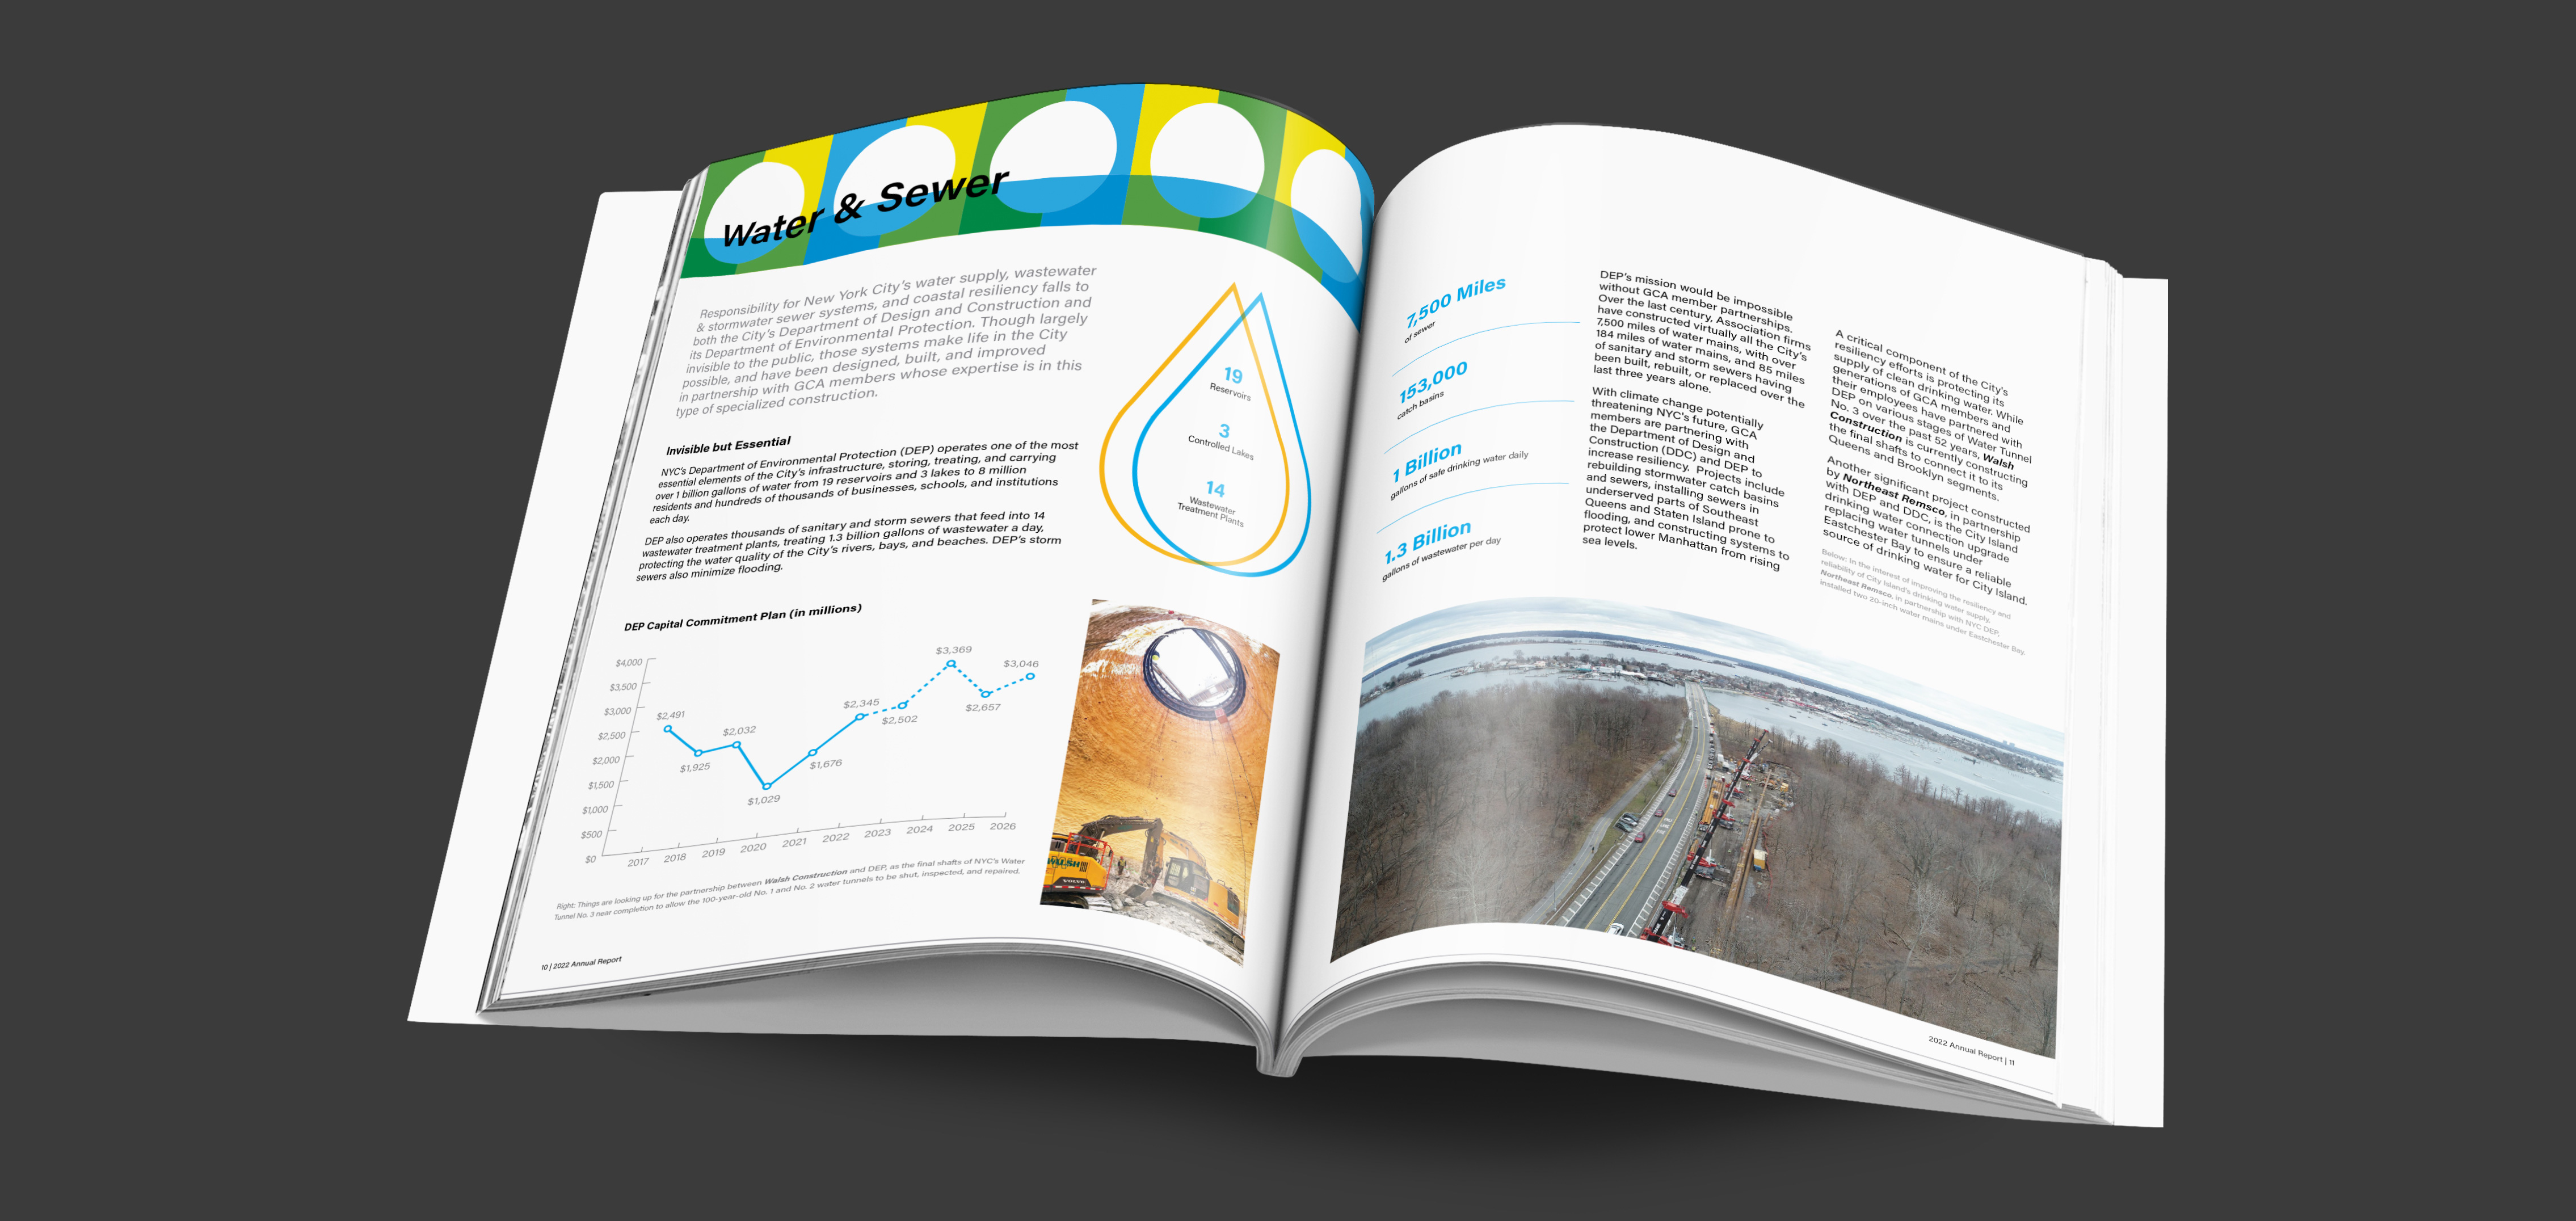
Case Study: General Contractors Association Annual Reports
We created the 2022 GCA Annual Report for the 6th year, focusing on “Partnerships That Build New York.” Infographics are the visual language we use to illustrate key data and abstract concepts such as Labor Relations, Safety, and Advocacy, which are the backbone of GCA’s offerings to their members.
“Folks loved the Annual Report. Thanks for all your help.”
Felice Farber, Senior Director Policy & External Affairs | General Contractors Association of NY
About Odgis + Co
Communicate with your audience and stakeholders in a streamlined and effective way. Turn pages and pages of numbers and gigabytes of big data into impactful, visually appealing infographics. Odgis + Co is an award-winning design agency in New York City. We have acquired intellectual capital from 35 years of working with our client’s from some of the world’s most sophisticated companies. We target your audience with the information that they need to know. “Less clutter, more clarity.”