Q1 Quarterly Reports
Terra Holdings
Terra Development Marketing & Brown Harris Stevens came to Odgis + Co for a refresh of their Quarterly Reports.
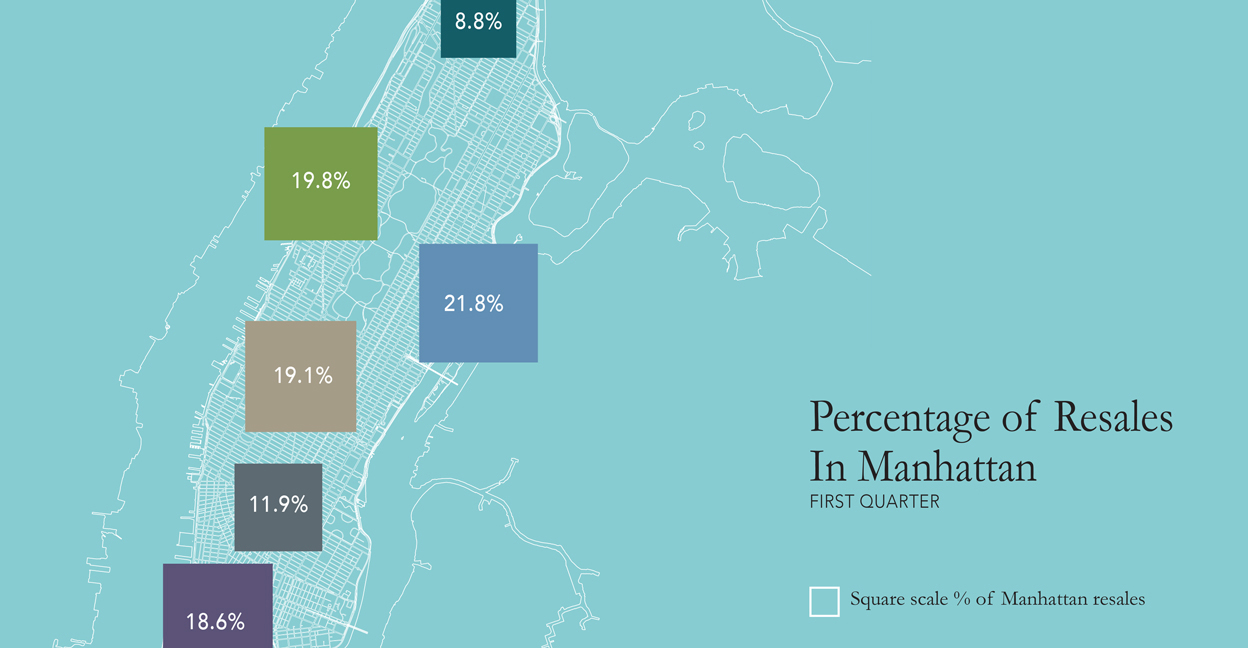
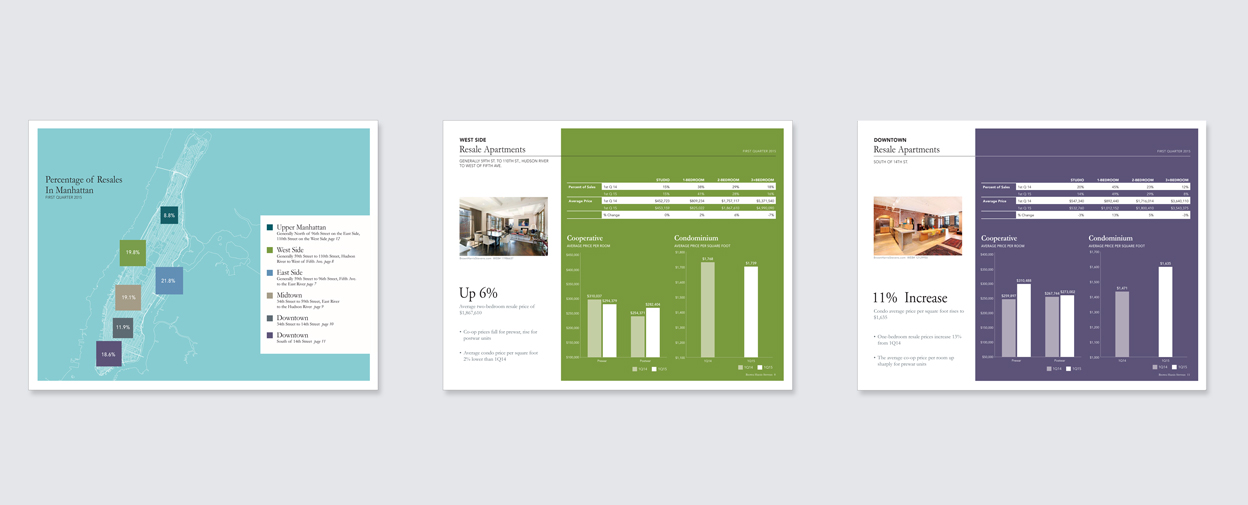
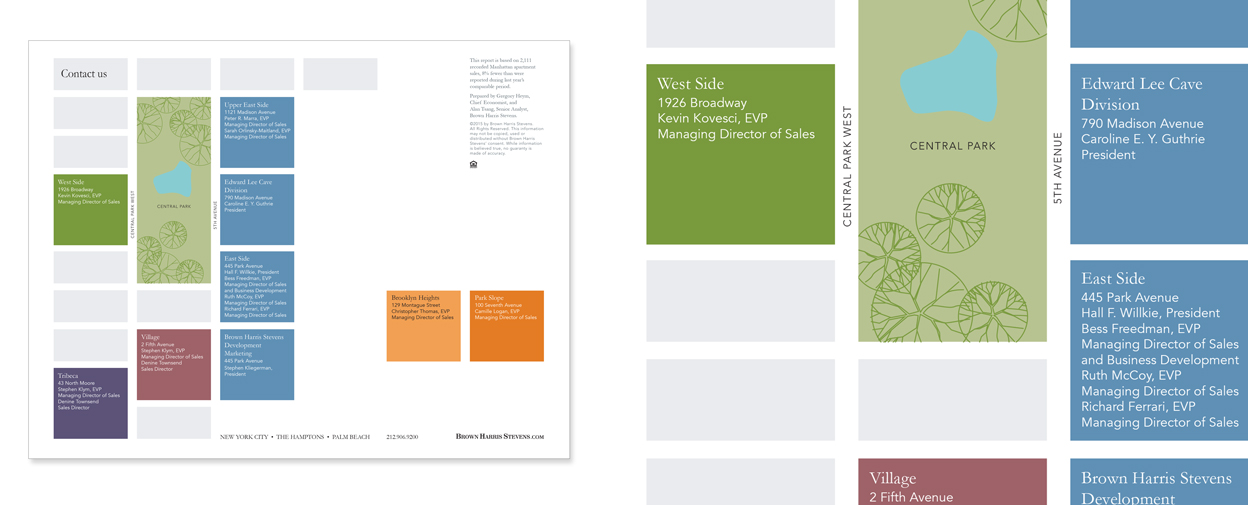
We changed the orientation of the report from vertical to horizontal – an appropriate ‘landscape’ format. We extended their color palette and assigned colors to the different regions. Using the color palette as a key we created a map/grid of Manhattan. The report ends with a grid-like contact page that corresponded to the geographical areas that were covered by the brokers. This template was created to be easily updated internally and also could be used for all the other regions that require special reports.
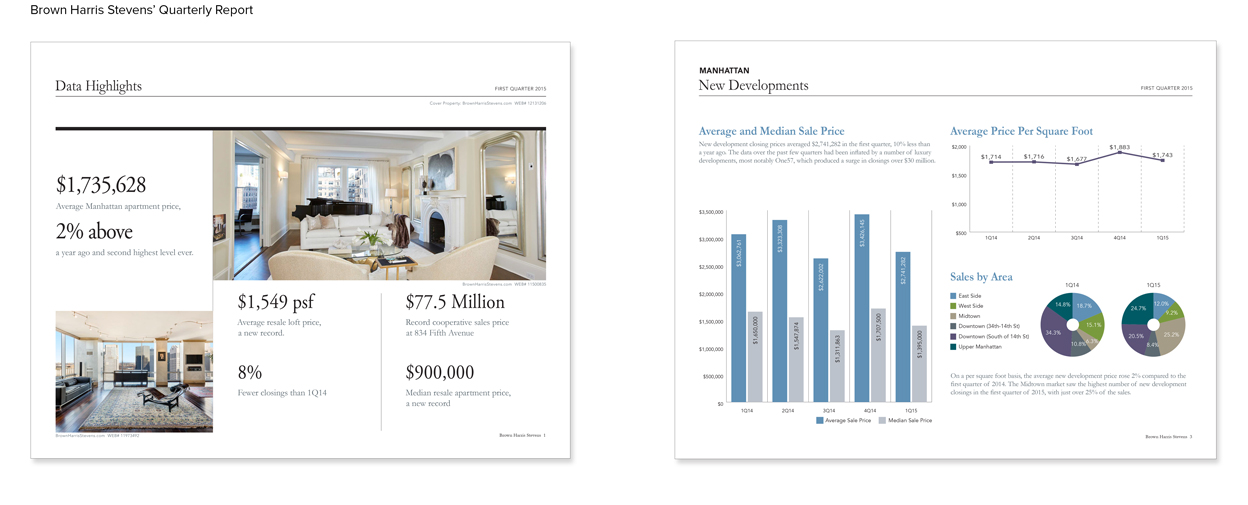
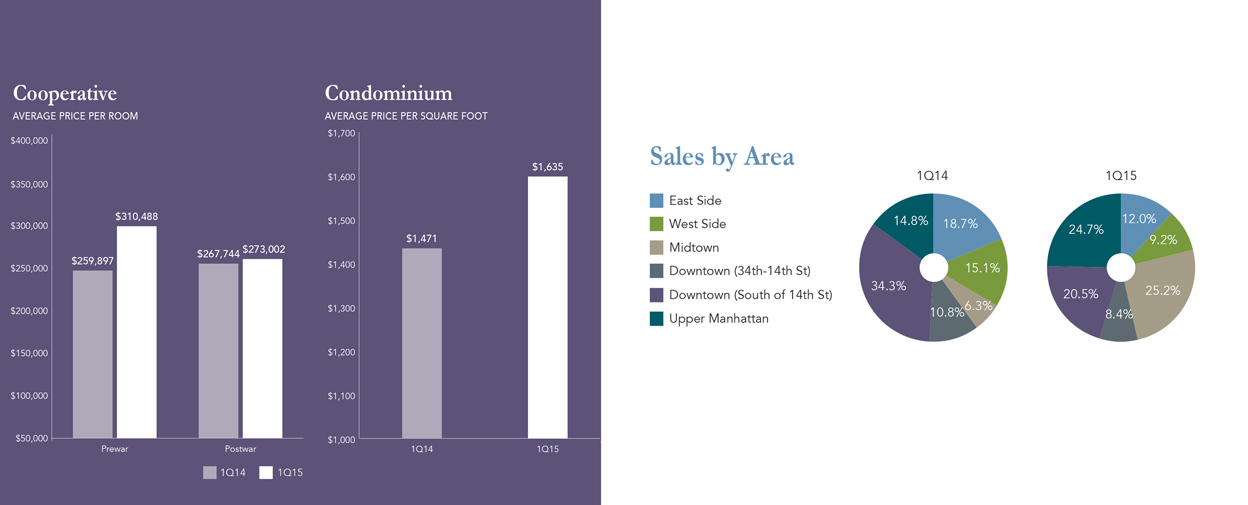
The statistics are divided up by geographic areas presenting growth information about Manhattan and Brooklyn real estate. We worked with their economist to develop charts that clearly told this development story.
We changed the orientation of the report from vertical to horizontal – an appropriate ‘landscape’ format. We extended their color palette and assigned colors to the different regions. Using the color palette as a key we created a map/grid of Manhattan. The report ends with a grid-like contact page that corresponded to the geographical areas that were covered by the brokers. This template was created to be easily updated internally and also could be used for all the other regions that require special reports.
The statistics are divided up by geographic areas presenting growth information about Manhattan and Brooklyn real estate. We worked with their economist to develop charts that clearly told this development story.
"I want to thank you for the suburb work you did. The report has been very well received. We look forward to more profitable and long lasting opportunities in the near future."
Stephen G. Kliegerman | President
RELATED WORK
Paramount Group
Paramount 2023 ESG Report

Vornado Realty Trust
Vornado 2022 ESG Report